The views
What colour and thickness mean in each view, and what each state of a flow tells you.
A view decides what the map shows. Switch views from the view menu at the bottom left: its button names the view on the map and opens the list of all views. The legend follows. Thickness is the Value in every view, except What changed, where it is the larger of the two periods. In a high-contrast theme, where colour is gone, Variance to objective uses the size of the gap and a Quantity or Rate or average view uses its measure. For readers who do not see colour, the Accessibility patterns setting marks unfavourable and falling flows with hatching, and missing or unknown ones with dots.
Value
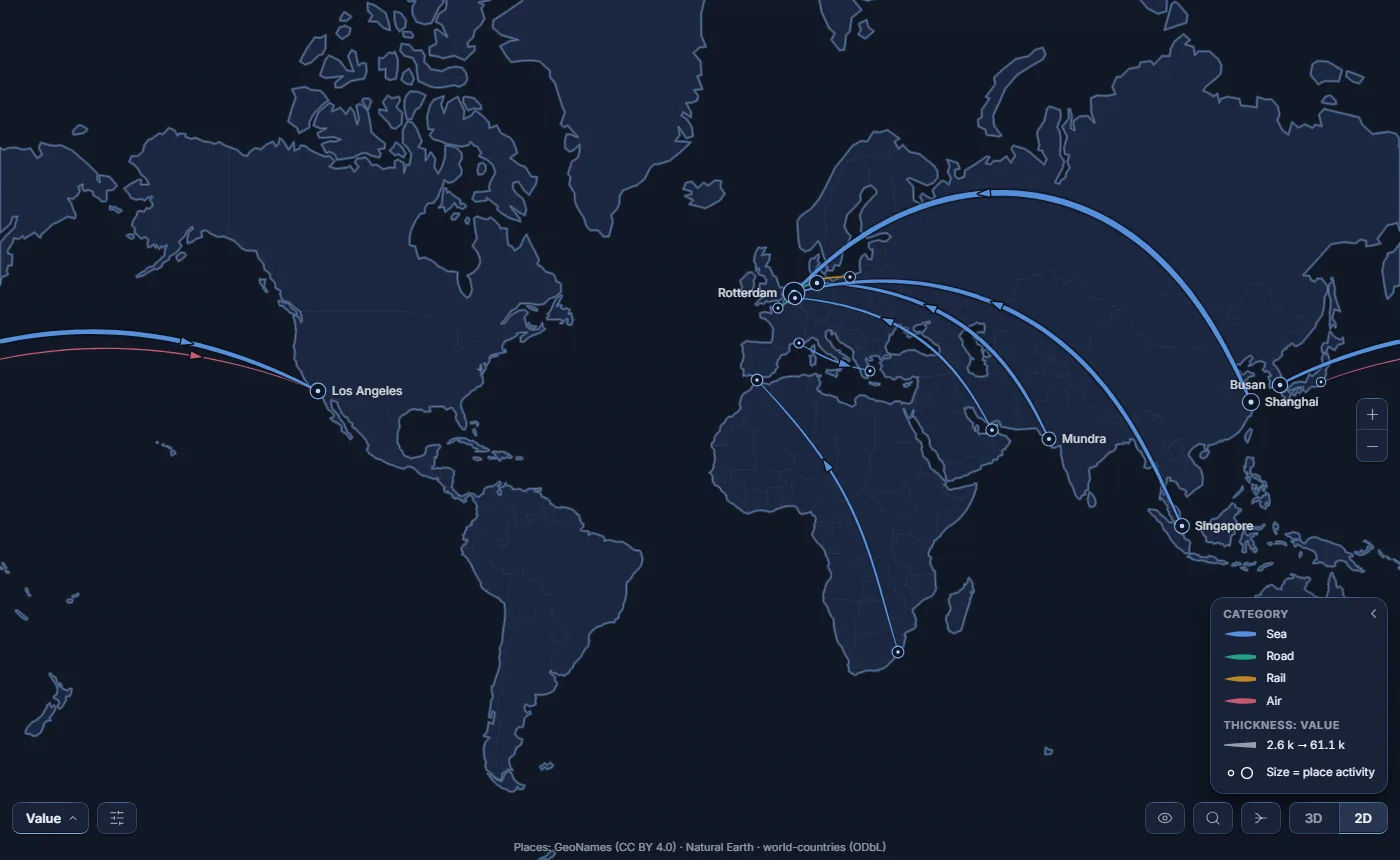
The default view. Thickness is the Value. Without a Category, flows share one line colour, a little brighter as they grow. With a Category, each category has its own colour; a flow that mixes several categories takes the colour of the one that weighs most, and its card gives the share.
Category colours are set in the Format pane under Category colours.
Variance to objective Premium
Unlocks once a measure is placed in Objective; until then it stays in the view menu, greyed, with the reason.
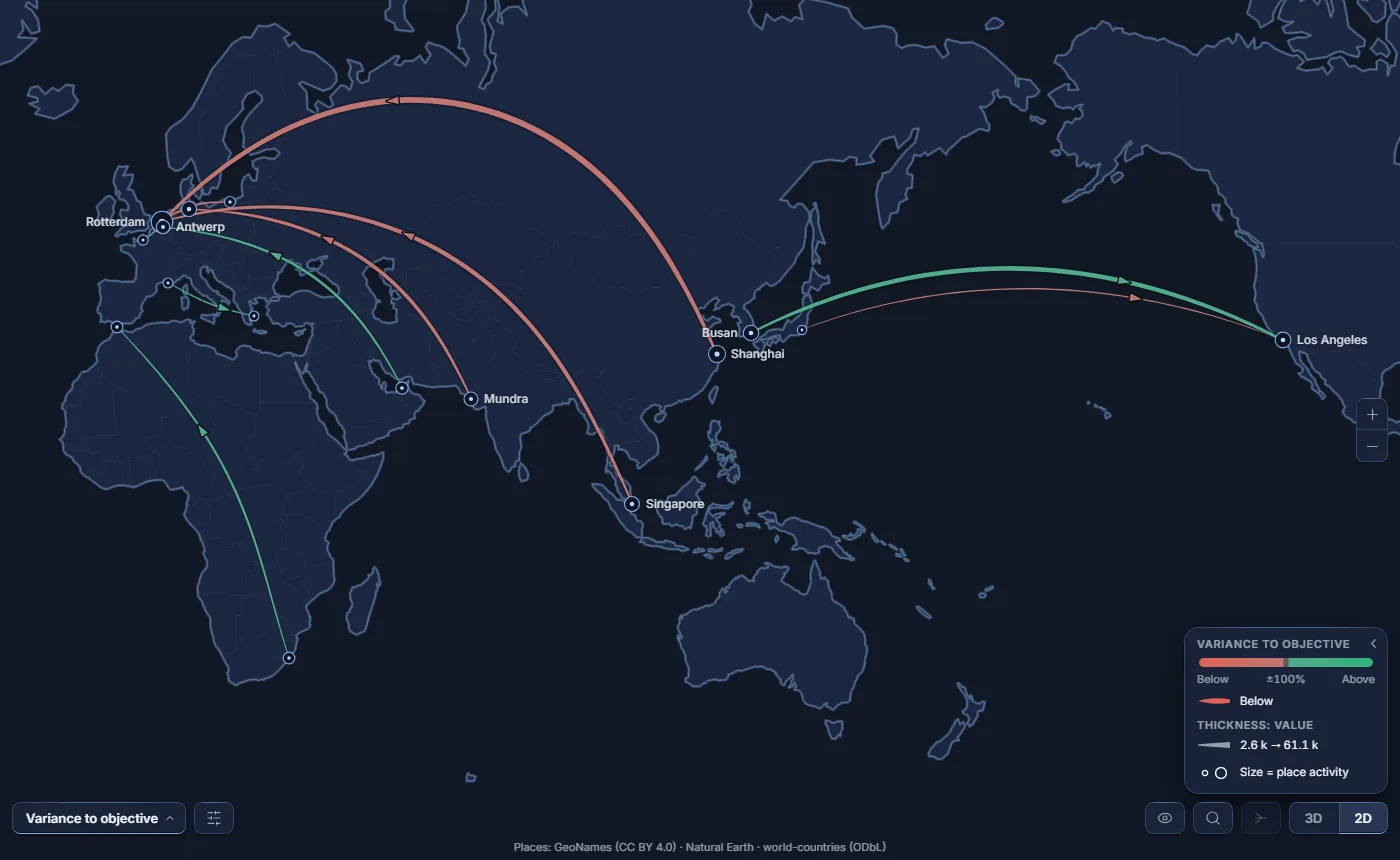
- Colour says which side of the objective a flow is on - favourable or unfavourable - and how strongly, up to ±100 %. Within 0.5 % of the objective, a flow is on plan and drawn neutral.
- Thickness is the value, as in the Value view: colour alone carries the gap. In a high-contrast theme, where colour is gone, thickness carries the size of the gap instead.
- No objective is never mistaken for “on plan”: those flows are grey - and dotted when Accessibility patterns is on.
- By default, higher is better. For a cost or a lead time, turn off Higher is favourable in the Format pane, card Variance to objective, where the two colours are also set.
What changed Premium
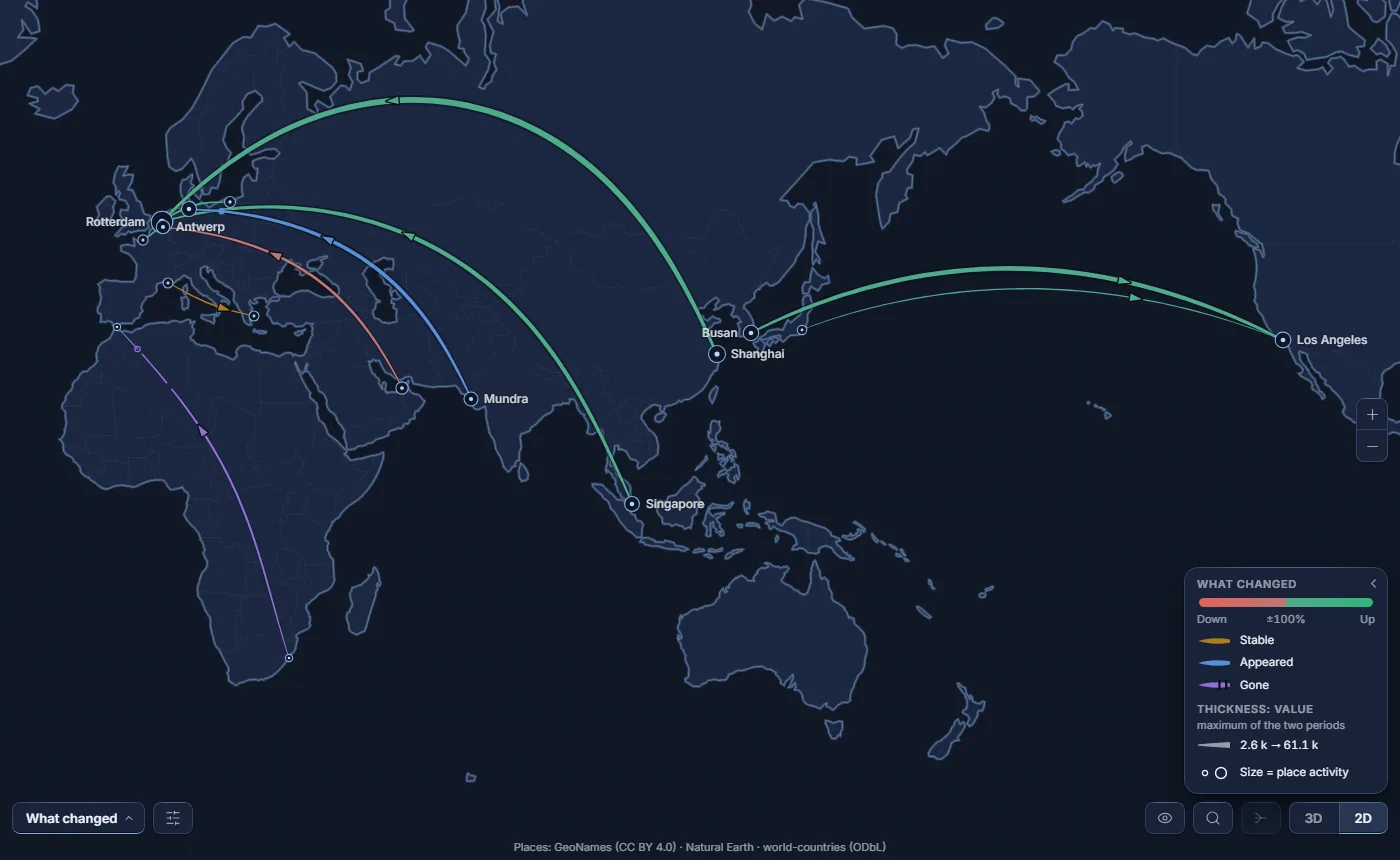
Unlocks once a measure is placed in Previous value; until then it stays in the view menu, greyed. Each flow is compared with its previous value and given one of these states:
| State | When |
|---|---|
| Appeared | No previous value - or a previous value of zero - and a value today. |
| Gone | A previous value, and nothing today. The flow is still drawn, at the volume it used to carry, and its ribbon is cut towards the end. |
| Up | 5 % or more above the previous value. |
| Down | 5 % or more below. |
| Stable | Less than 5 % either way. |
| Unknown | The two cannot be compared - for instance two opposite flows netted into one, when only one direction has a previous value. |
Thickness is still the Value - taken as the larger of the two volumes, today's or the previous one, so that a flow that collapsed stays as visible as it used to be. The legend only lists the states that are drawn on the map. If only some rows of a flow carry a previous value, the flow is compared on what those rows add up to: a new carrier on an existing corridor makes it Up, not Appeared.
Views on your own fields Premium
Each field placed in Extra measures or Extra categories - up to two of each - adds a view to the menu, named after it. Thickness stays the Value.
- Extra measure
- The measure sets the colour; how it is read depends on its Measure type, set in the Format pane, card Extra measures. A Quantity is added up across rows and a Rate or average is averaged, weighted by Value; both colour the flows on a ramp. Levels takes the level that carries the most Value - mixed on a tie - with one colour per level; Boolean colours by the share of rows that are true. Auto guesses from the data. While the view of a Quantity or a Rate or average is open, the card Colours - [your measure] sets the ramp's colours and thresholds. In a high-contrast theme, those two types set the thickness instead.
- Extra category
- One colour per value, with no “Others” bucket. The palette has 42 distinct shades before hues repeat; the Format pane card Colours - [your category] lists the 200 largest. When a flow mixes several values, its card says so and lists them on click.
Views and licences
Views marked Premium are part of the paid plan. Without a licence that covers them, when reading as when editing, the report opens in the Value view: every flow is still there; the Premium views and the concentration indices are withheld, and the cover filter stops applying. The Premium views stay in the menu, greyed. A reader with no plan, or whose plan is lapsed or suspended, is in that case; so is anyone Power BI cannot vouch for - Desktop signed out or offline, Publish to web, Report Server, Power BI Embedded, national clouds - and the report shows the free view while Power BI is still answering.
The visual writes no licensing message itself. Power BI shows its own licence icon to an author editing a report that uses a Premium feature, and its own banner when a Premium view is chosen. With an active plan, nothing is withheld. See Free and Premium.