Skip to content
GLYPHEIN

Glyphein Flow Globe

An origin-destination map for Power BI.

Origin, destination, value: three columns are enough. Flow Globe finds each place by name, so no coordinates are needed.

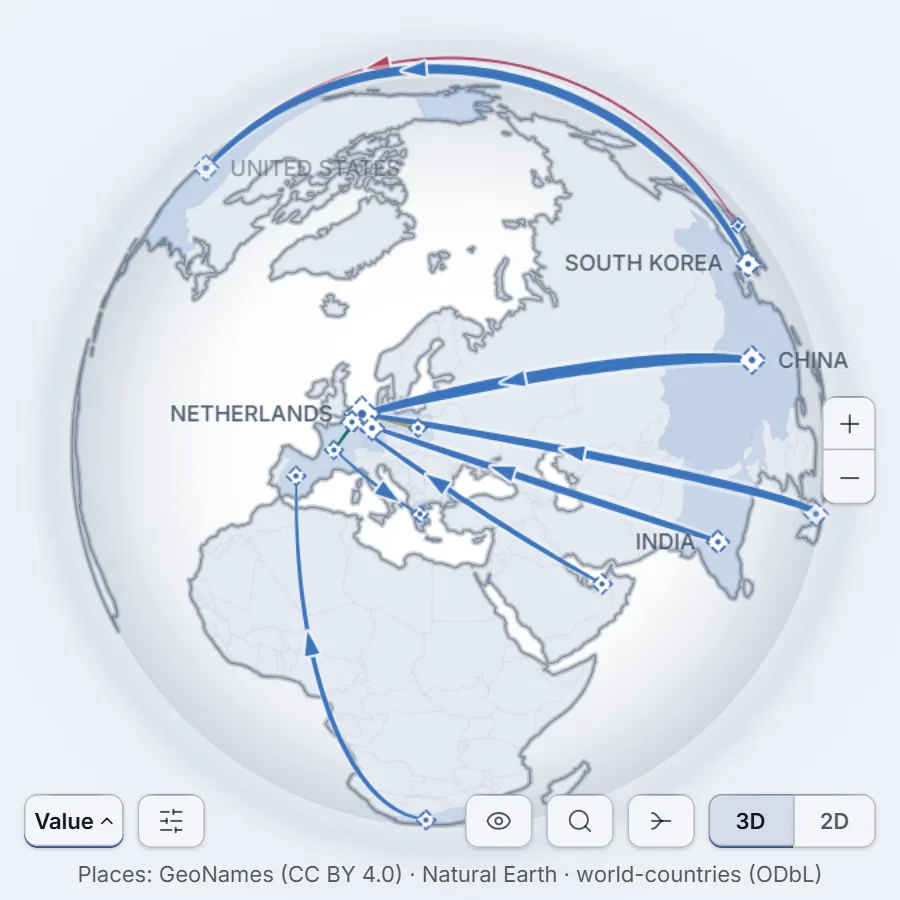
Flow Globe on a 3D globe at country level: arcs from China, India, Singapore, the United Arab Emirates, South Korea and South Africa converge on the Netherlands and Belgium, each arc as thick as its value. A further arc runs from South Korea over the North Pole to the United States.
A screenshot of the visual, at country level, on the sample data.

Three columns are all it needs.

Origin, Destination and Value. Flow Globe matches the names against 32,355 places built into the visual: 32,008 cities, 97 ports and 250 countries.

ISO codes work too. Latitude and longitude stay optional, and a country column settles shared names such as Toledo.

4 of the 12 corridors in the sample data, each summed over twelve months (Oct 2025 to Sep 2026).
OriginDestinationValue
ShanghaiRotterdam61.1 k
BusanLos Angeles42.8 k
SingaporeRotterdam37.0 k
MundraHamburg28.8 k

Five views of the same network.

A menu at the bottom left of the visual switches views. Only Value needs no extra field.

Flat map in the Variance to objective view: the twelve sample corridors, in red where they run below plan and green where they run above, with the visual's legend.

Variance to objective Premium

Add an Objective. Colour shows the gap to plan: red below, green above by default, grey within 0.5 %. Thickness stays the value.

A screenshot of the visual, on the sample data.

Flat map in the What changed view: the twelve sample corridors, in green where they grew, dashed red where they shrank and amber where they held steady, with the visual's legend.

What changed Premium

Add a Previous value. Each corridor is up, down or stable (within 5 %), appeared, gone, or unknown. A vanished corridor keeps its width.

A screenshot of the visual, on the sample data.

Value

The default. Thickness is the value. Add a Category and each flow takes its category colour; without one, every flow shares a single colour.

Extra measures Premium

Add up to two measures. Each becomes a view where colour follows that measure, named after the field.

Extra categories Premium

Add up to two categories. Each becomes a view with one colour per category, and no Others bucket.

Read a place, then read a flow.

Click a place on the globe, or pick one in the list, to read its card. In the visual, hovering a flow shows its value.

Rotterdam

Rank #1 of 16

Total activity
129.9 k
Share of the network
55 %
Inbound
129.9 k
Outbound
0
Connections
6

Top origins

  1. Shanghai47 %
  2. Singapore28 %
  3. Hamburg8 %
  4. Gdansk7 %
  5. Antwerp6 %

Concentration Premium

  • Top 5 concentration (both ways)96 %
  • Inbound concentration (HHI)High

Built for real networks.

  • Levels that follow the zoom

    Continents, then countries, then cities and ports as you zoom in. Or fix the level yourself.

  • Bundled corridors

    In the Value view, flows that share an endpoint and a direction can ride one trunk. The visual says bundled paths are schematic.

  • Top N and minimum value

    Show only the largest routes, or set a minimum value. With Premium, keep the corridors that carry a chosen share of the volume.

  • Search

    Type a place or a flow to find it. Search is also the keyboard route to any flow.

It says what it left out.

Whenever the visual cannot place a name, merges rows or leaves flows out, a notice says what was affected.

That covers unknown names, shared names, contradicting coordinates, merged rows, the render limit and values that are not numbers.

A Diagnostics panel counts input rows, valid and rendered routes, unresolved places. Every notice is explained in the manual.

Displaying your data is always free. What Flow Globe computes is Premium.

Free

  • Globe and flat map, place-name matching, zoom levels
  • Value view: thickness, colour by category, legend
  • Flow cards and place cards, with each place's top origins and destinations and dependency analysis
  • The single-origin alert, whatever the licence
  • Search, Top N, minimum value, bundling, reciprocal flows split or netted
  • Selection and cross-filtering, dark and light themes, high contrast, diagnostics

Premium

  • Variance to objective view
  • What changed view
  • Views on your extra measures and categories
  • Cover % of volume filter
  • Concentration of a place: top 5 and inbound (HHI)

Premium appears only when Power BI confirms the licence. Otherwise the report opens in the Value view and every flow stays on the map.

Plans and prices will be published with the AppSource release.

For every reader.

  • English
  • Français
  • Deutsch
  • Español
  • Italiano
  • Nederlands
  • Português
  • 日本語
  • 한국어
  • 中文
Ten languages
The interface follows the report's language, or you pick one. Country names are translated too.
More than colour
Optional hatching and dots mark unfavourable, falling and missing flows as well as colour does. They switch on by themselves in high-contrast mode.
Dark and light
Two themes, chosen in the Format pane. High-contrast mode uses the colours Power BI provides.
Keyboard and motion

Arrow keys move between the places in view, Enter selects and Escape closes the card. Search reaches any flow.

Animation stops when the system asks for reduced motion.

Need to clear it with IT?

The visual makes no network call and declares no privilege. The security page shows where to check.

Read the security notes