Settings
What can be changed from inside the visual, what belongs in the Format pane, and how the visual adapts to its readers.
Settings live in two places. Options, inside the visual, holds what a reader may want to change while exploring. The Format pane of Power BI holds what the author sets once. What you change in either is saved with the report.
Options
The sliders icon next to the view menu, bottom left. The panel opens above it. The routes, minimum value, cover, bundling and reciprocal-flow settings appear once there is data on the map.
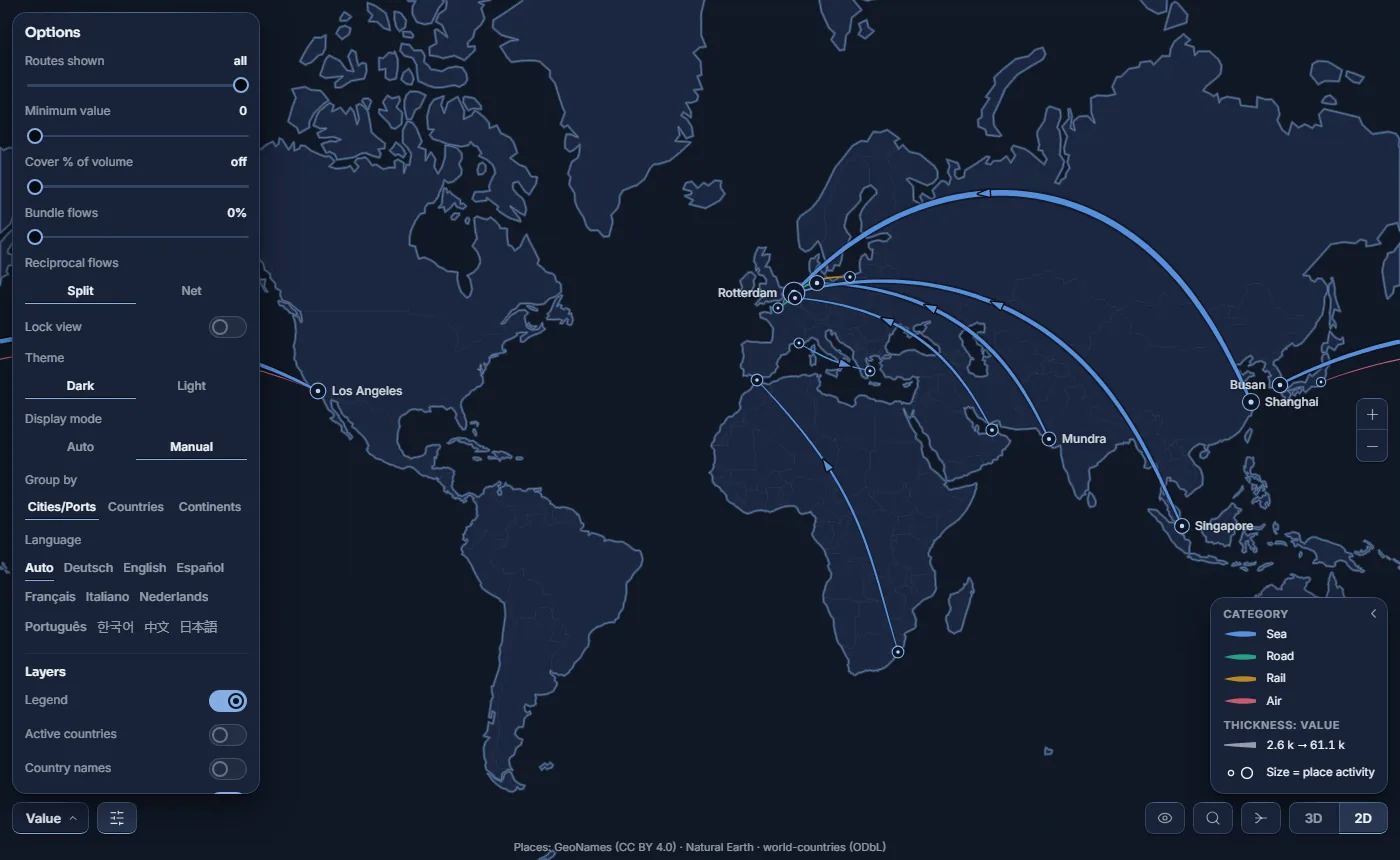
| Option | What it does |
|---|---|
| Routes shown | Keeps the N largest flows. |
| Minimum value | Hides flows below a value. |
| Cover % of volume Premium | Keeps the corridors that carry the chosen share of the volume. Greyed for a reader without a plan. |
| Bundle flows | How far bundling gathers flows, from 0 to 100 %. Value view only; greyed elsewhere. |
| Reciprocal flows | Split or Net. Net needs a Value, and is greyed without one. |
| Lock view | Stops automatic reframing. |
| Auto-rotate | Turns the globe slowly. 3D only, while the view is not locked. |
| Theme | Dark or Light. |
| Display mode | Auto: layers and detail follow the zoom. Manual: you choose. |
| Group by | Cities/Ports, Countries or Continents. Manual mode only. |
| Language | Auto follows the report; or pick one of ten. |
| Layers | Legend, and in Manual mode: active countries, country names, graticule, borders, regions (with borders on), labels. |
| Animation | Particles, Arrows or None. |
| Diagnostics | Opens the Data diagnostics panel. See Notices and diagnostics. |
Format pane
Select the visual, then open Format visual. The cards, in order:
| Card | Settings |
|---|---|
| Flows shown | Reciprocal flows · Show all routes · Routes shown · Minimum value · Cover % of volume |
| Flows | Line colour · Animation · Direction mark at rest · Path · Bundle around · Render limit |
| Nodes | On/off switch in the card header · Labels · Size (%) · Dependency analysis (on by default) · Shapes: Cities, Countries, Continents |
| Legend | Show |
| Value format | Display units · Decimal places · Regional format |
| Variance to objective | Favourable and Unfavourable colours · Higher is favourable |
| Category colours | One colour per category. Present in the Value view when a Category is used; in the view of an extra category, the card is named Colours - [category]. |
| Colours - [measure] | Low, mid and high values colours, and their thresholds, for the ramp of an extra measure. Present while that measure's view is open, for the Quantity and Rate or average types. |
| Extra measures | Measure type of each extra measure. |
| Base map | Theme · Accessibility patterns · Display mode · Group by · Borders · Regions · Active countries and their colour · Country names |
| Camera | Lock view · Fit on load · Fit on selection |
| Hover | Rendered by: Glyphein (built-in) or Power BI (report page tooltips) |
Some settings are greyed while Display mode is Auto, because the zoom decides them; switch to Manual to set them by hand. Others are greyed while a neighbour governs them - Routes shown under Show all routes, the two fits under Lock view - and each says why.
Languages
The visual speaks English, French, German, Spanish, Italian, Dutch, Portuguese, Japanese, Korean and Chinese, and writes country names in the same language. By default it follows the language of the report; Language in Options overrides it. Number separators follow Regional format, in the Format pane card Value format; on Auto, they follow the report, or the language chosen in Options.
Accessibility
- Keyboard. Every control is reached with Tab and used with Enter or Space; sliders move with the arrow keys, and so does the choice in the view menu. Esc closes the detail card, the view menu and the search. The map itself is a single Tab stop: the arrow keys, Home and End move between the places in view, from the largest to the smallest; Enter or Space selects the one you reached, as a click would, and a screen reader announces each place. Flows are reached through Search.
- Patterns. Accessibility patterns, in the Format pane card Base map, repeats colour with a second channel: hatching on unfavourable or falling flows, dots where data is missing.
- High contrast. In a Windows high-contrast theme, the visual draws with the theme's colours and turns the patterns on by itself. Where colour carried the reading - the gap to the objective, a Quantity or a Rate or average - thickness carries it instead.
- Reduced motion. When the system asks for reduced motion, the visual stops its animations and the globe no longer turns by itself.