Getting started
Add Flow Globe to a report, place three fields, and read the map.
Add the visual to a report
Once Flow Globe is published, it is added like any visual from Microsoft AppSource: in the Visualizations pane, choose Get more visuals and search for Glyphein Flow Globe.
If you were sent a .pbiviz file, choose Import a visual from a file
in the same menu instead. The visual's icon then appears in the Visualizations pane; click it to
place an empty Flow Globe on the page.
An empty Flow Globe shows a welcome page: one sentence on what the visual draws, then the three fields to fill, in order - Origin, Destination and Value. Each field is ticked once added, and the page names what is still to add. It gives way to the map as soon as Origin and Destination are in place. Its Manual link opens this manual in your browser.
Flow Globe is free to use. Without a plan, a report keeps the whole free version: the map, the Value view, the cards, Top N and the minimum value. A few views, a filter and two indices are Premium - they are marked as such in this manual, and listed on the Flow Globe page. Premium features appear only when your Power BI account holds a Flow Globe licence, while editing as well as reading; otherwise you see the free equivalents, and Power BI shows its own licence icon on a report that uses a Premium feature.
Draw a first map
Three fields are enough:
- Origin - a column of place names: countries, cities, ports or ISO codes.
- Destination - the same, for where each flow arrives.
- Value - a measure, such as a sum of amounts, tonnes or shipments. It sets the thickness of each flow.
The map appears as soon as Origin and Destination are filled. Without a Value, each row Power BI sends - one per distinct combination of the fields - counts as one, and the visual asks for a measure. Places are found by name inside the visual - there is no latitude or longitude to prepare. The chapter Place names explains how.
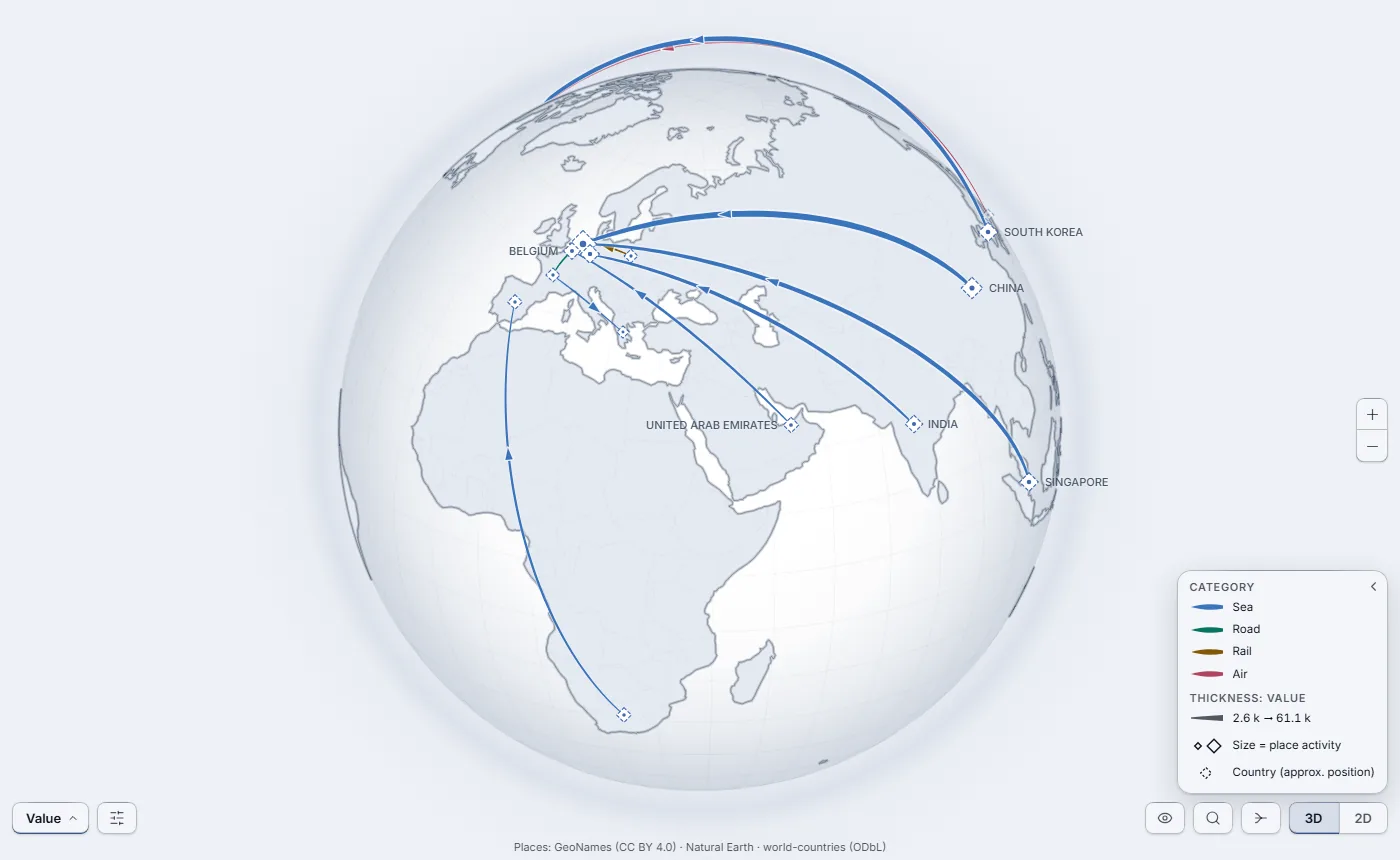
What you are looking at
- Arcs
- One per origin-destination pair. Thickness is the value, in every view; in a high-contrast theme, where colour is gone, some views use thickness for the gap or the measure instead, and the legend says so. The legend gives the range. By default, small particles travel along each arc to show its direction; Animation in Options changes that.
- Places
- A marker at each end. Its size is the place's total activity - everything that leaves it and arrives at it.
- Legend
- Bottom right. It says what colour, thickness and marker size mean in the current view. The chevron at its top right collapses it into a small tab; on a small visual it collapses by itself and unfolds while you point at it. A long list of categories scrolls.
- Level
- In the Auto display mode, zoomed out, flows are grouped by country, or by continent; zoom in and they resolve to cities and ports. Countries and continents are labelled in capitals.
The controls
The controls sit along the bottom edge, so that the map keeps the whole frame; zoom is on the right edge, and notices appear at the top left. The left of the bar holds what you look at, the right holds how you look at it.
| Control | What it does |
|---|---|
| View menu | Bottom left. A button named after the view on screen; it opens, above it, a menu of every view: Value, Variance to objective and What changed, then one entry per extra measure and per extra category. A view that needs a field stays in the menu, greyed, and names the field to add. A Premium view outside your plan is greyed without text; if you choose it, Power BI shows its own banner. See The views. |
| Options | The sliders icon, next to the view menu. Routes shown, minimum value, cover (% of volume), bundling, reciprocal flows (split or net), view lock, theme, display mode and level of detail, language, layers and animation - and the Diagnostics panel. See Settings. |
| Hide controls | The eye, bottom right. Hides the controls, the legend and the notices for a clean screenshot; the eye stays - click it again to bring them back. |
| Search | The magnifier. Type a place or a flow to find it, select it and centre the map on it. Its first entry, Reset view, returns to the default view. |
| Bundle | Gathers flows that share an endpoint and a heading onto a common trunk, and ungroups them. Value view only, greyed elsewhere; the Bundle flows slider in Options sets how far. |
| 3D | 2D | Globe or flat map. |
| + and − | Zoom in and out. On the right edge. |
On the map itself: drag to turn the globe or move the flat map, scroll to zoom. Hover a flow or a place for its figures; click it for the full card. Clicking also selects it, which filters the other visuals on the page - see Map and cards.
Next steps
- Add an Objective measure to see which corridors run under plan.
- Add a Previous value measure to see what appeared, went, grew or shrank.
- Add a Category, such as a transport mode or a carrier, to colour the flows.
Your data describes every field well.